Context & Motivation
According to the American Alliance of Museums, 7 million visually impaired individuals in the US face a largely inaccessible cultural landscape. This project introduces VISTA (Visual Information through Sensory Tactile Array), a novel tactile display designed by our team to convey both the structure and appearance of art through touch.
System Architecture
The system utilizes a 7x5 pin array where Shape is rendered by actuated pins and Color is encoded via variable pin height.
Engineering Implementation
Mechanical Actuation & Constraints
The device requires precise independent control of 35 pins. I optimized the mechanical packaging to bring the pins as closely together as possible:
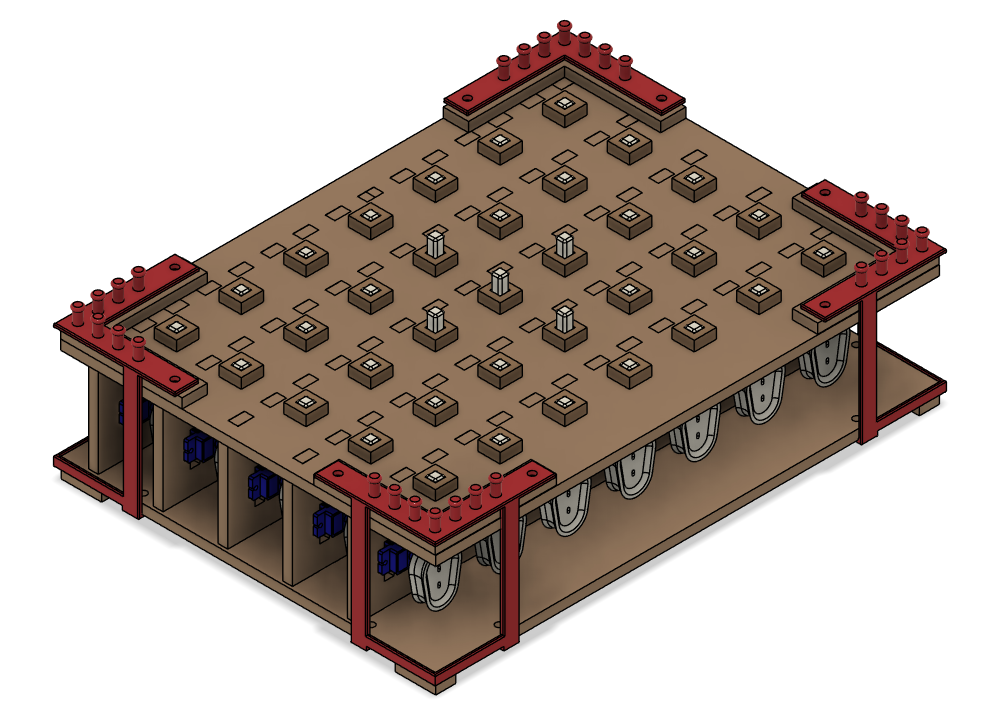
- Cam Design: The cams have a 1.5" pitch radius to achieve the 4 distinct height levels. This necessitated a pin spacing of 1.6 inches, creating a coarse but intelligible grid for palm-based interaction.
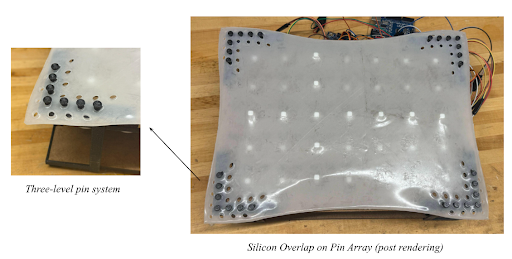
- Silicone Interface: To bridge the gap between discrete pins and a continuous image, the team designed and fabricated a Smooth-On Ecoflex™ 00-30 silicone overlay. The surface was coated in cornstarch to reduce friction and utilized a 3-level tensioning system to optimize tactile transmission.
Electronics & Logic Pipeline
The team developed a control system to translate pixel data into physical topography using a custom mapping algorithm:
- Color-to-Height Mapping: We quantized colors into 4 discernable height levels to convey depth:
Yellow (17.5mm) > Red (9.8mm) > Blue (6.3mm) > White (2.7mm)
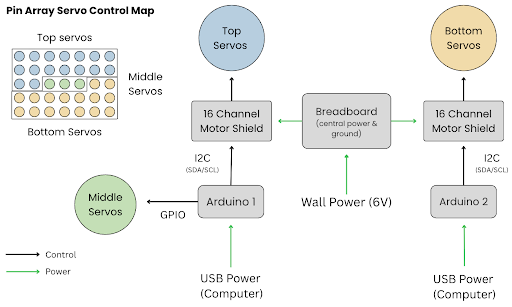
- Distributed Control: The team implemented an electronic architecture with two Arduino boards managing 35 servo motors (one per pin) to handle the high PWM channel load. Each pin was actuated individually to render an image to ensure the servo motors did not surpass the Arduinos’ current limits.
Performance & Results
We validated the device using a "Flag Identification" study (Japan, Sweden, Denmark) to test shape vs. color recognition:
- Shape Recognition: 100% of participants successfully distinguished flags with differing geometries (e.g., Japan vs. Sweden).
- Color Distinguishability: While pure color differentiation (Sweden vs. Denmark) proved challenging (35% error rate initially), the addition of a tactile legend allowed users to accurately map height to color.
Demos
Japan Flag Demo
Denmark Flag Demo